Marco Galardini
09 November 2023
Just a couple of days ago we have published a research article describing
panfeed, a software tool
to aid bacterial GWAS studies. This effort was
led by Hannes, with the help of Dilfuza
during peer review.
As everyone in the field of genomics has heard ad nauseam, we now have an abundance of
genome sequences available; when that is combined with phenotypic measurements the obvious
question is then “which gene is responsible for this phenotype?”. Statistical genetics (i.e.
genome-wide association studies, GWAS) would be one way to answer that question, or rather
the more correct one “which genetic variant is associated, and hopefully causal, for the
variation in phenotype, across this collection of genomes?”.
When asking this question in the context of bacterial genomes, the term “genetic variant”
can take a number of meanings, going from “classical” short variants such
as SNPs/InDels, to entire operons being transferred horizontally and even genes changing
their arrangement. One clever way to
encode all these variant types is to use a k-mer, which is a DNA “word” of length k
(typically 31).
While this solution allows one to collapse different genetic variant types into a unified
data structure, it generates two problems: one of ambiguity and one of interpretability.
These are the problems that we aim to ameliorate (hopefully solve for most people!) with panfeed.
Let’s go over both problems then.
Greatly simplyfing, one way to generate k-mers from a set of genomes is to take the input genomes
and put them into a blender that chops them into k-mers. The output can be then seen as a big haystack
from which we have to find the proverbial needle (the causal variants). The problem is that some genes
(which in bacterial genomes are pretty much the main unit of molecular function) will share some k-mers,
which will then implicate unrelated genes with the focal phenotype (as well as subtly modifying the presence/absence patterns
of those shared k-mers, affecting the association results themselves). That’s the ambiguity problem that needs to be solved;
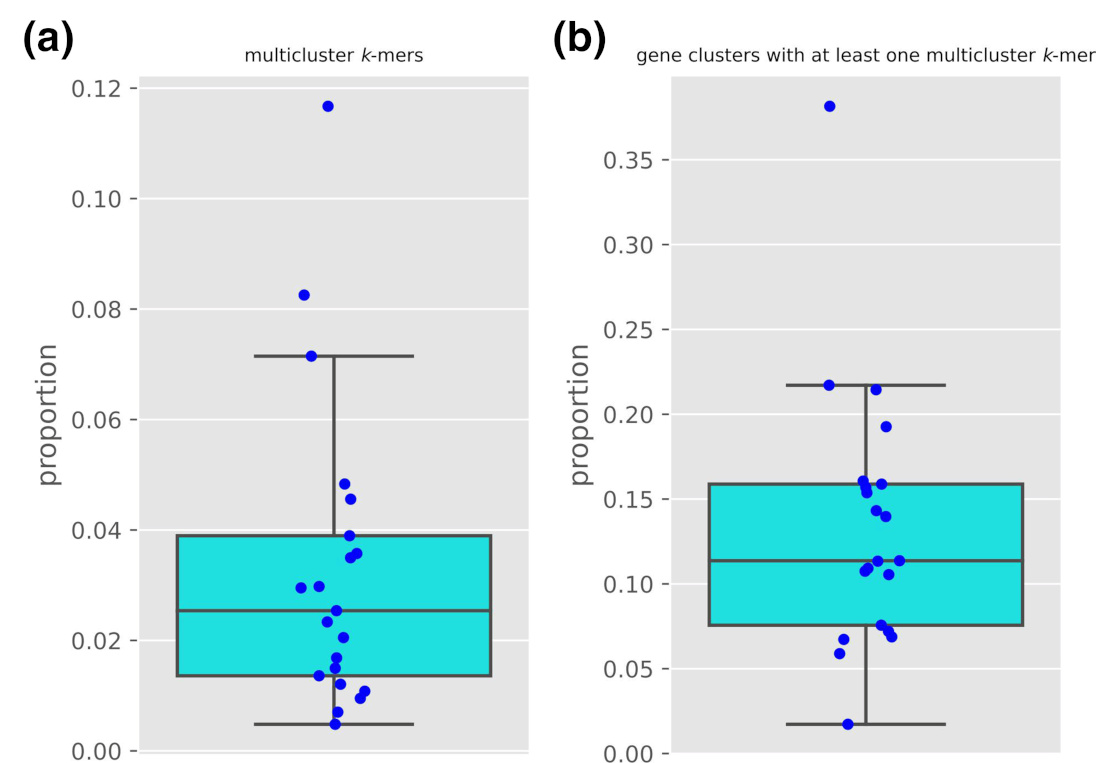
using data from 21 bacterial species’ genomes we indeed show how on average 3% of k-mers are duplicated across genes
and how 13% of genes have at least one k-mer shared with at least another gene.
The problem of interpretability also stems from all genetic variants being in a big haystack: once you have found your needle,
how do you figure out 1) which gene it might belong to, and 2) which variant type it encodes?
You can surely map the k-mers back to the input genomes, but you would lack the local context, meaning which other
genetic variants are present in that genomic location across all the genomes in the sample.
We address both problems by leveraging the assumption that genes are the unit of function in bacterial genomes and what
most people will use to interpret results. So basically instead of having a single haystack, we generate many (tens of thousands in fact!)
smaller ones and search for a needle in each of them. To be more specific, we use the gene cluster definitions given by tools
such as panaroo and ggCaller
and extract k-mers and their presence/absence patterns from each gene cluster separately.
This means that a k-mer that is duplicated across gene clusters is allowed to have a different presence/absence pattern for each gene,
thus reducing false gene leads.
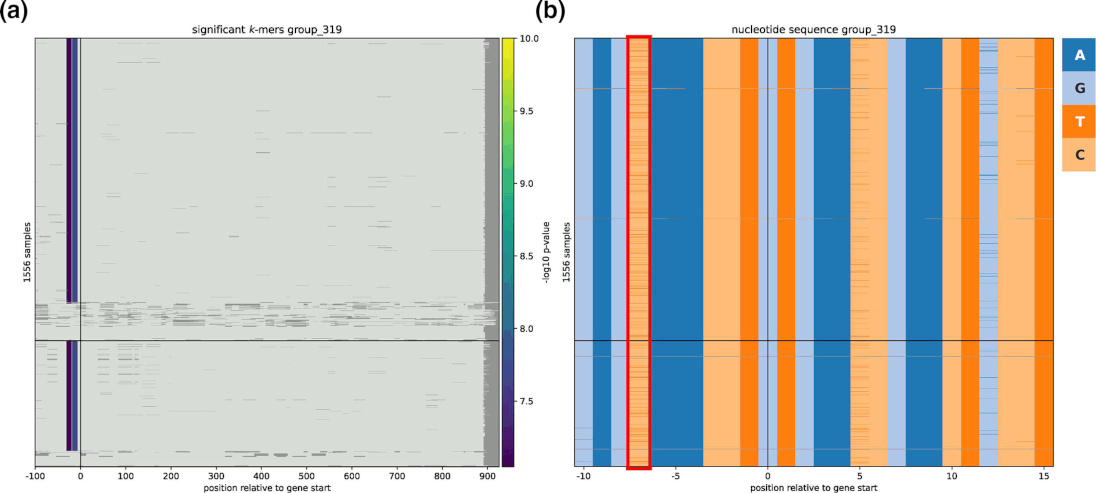
Interpretation is improved by linking k-mers and their source gene directly, as well as showing the local context of the associated variants,
which can optionally include promoter regions, as shown below.
panfeed is available as a conda package in bioconda (mamba create -c bioconda -n panfeed panfeed),
as a pypi package (python3 -m pip install panfeed),
and its source code and issue tracker can be accessed in our lab’s github. Happy needle search!